
Fixing A Swift Memory Leak
I wrote a Mac menu bar app for internal use at Etsy that show the status of a number of internal systems and pops up a notification if any of them change status—for example, if a problem is detected and someone puts a hold on our deployment queue. 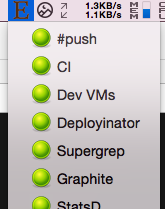
Some months ago, a colleague noticed the app was leaking memory. I put off looking at it until recently, when I noticed that my own instance was eating up 3+ GB of memory.
Fortunately, Apple provides some great tools for tracking down leaks. One is Instruments, an incredibly powerful tool that I know thiiis (puts thumb and forefinger a millimeter apart) much about. But I know enough to inspect a process for leaks.
I started Instruments, selected the Leaks profiling template, and attached it to my leaky app, and saw this:
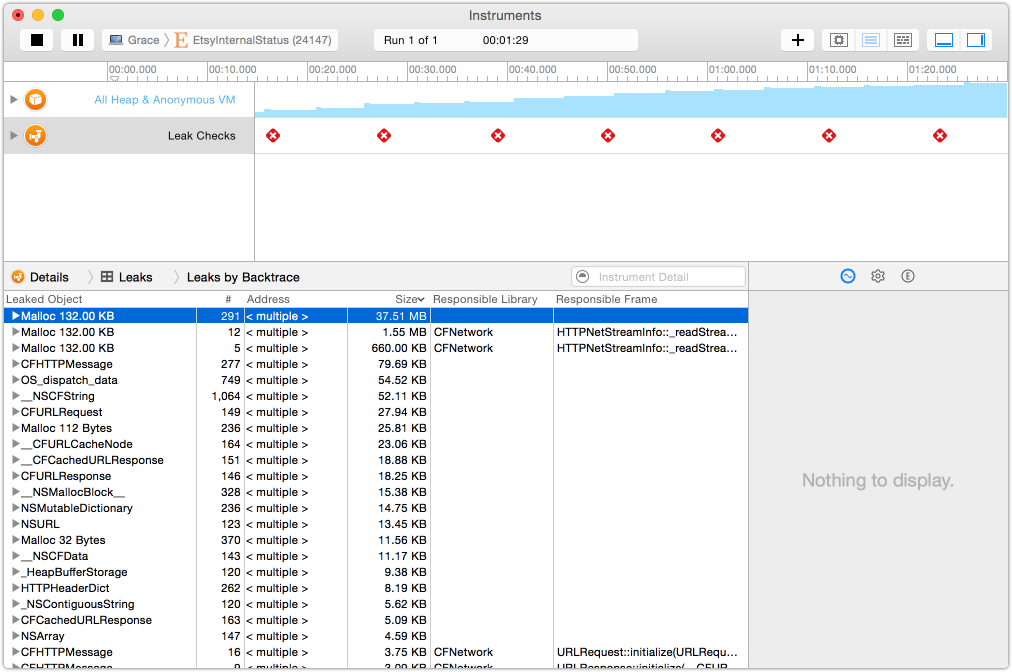
Yup, that’s a leak. You can also drill down to see where the leak is coming from:
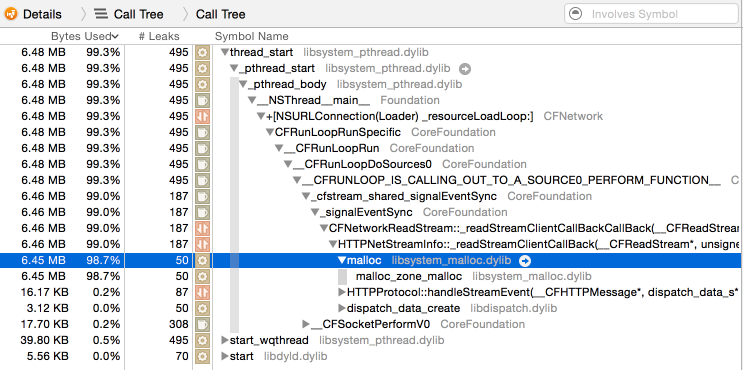
So the leak is obviously in the networking code, seemingly in Apple’s part of it.
I should pause here to say a bit about how the app works. It’s pretty simple: every 3 seconds, it fetches an internal status web page, parses out the statuses from an HTML table (writing a JSON endpoint for the status page is on my todo list!), and updates the menu accordingly.
The networking code in the app was pretty simple:
let session = NSURLSession.sharedSession()
let task = session.dataTaskWithURL(url) { data, response, error in
    // check for error, do something with the data
}
task.resume()
NSURLSession was introduced with in Mavericks and iOS 7 as a replacement for NSURLConnection.
I tried setting the cache sizes to 0, and invalidating the session when I was done, as recommended in this article, which seems to describe the same leak:
// THIS CODE DID NOT HELP!
let configuration = NSURLSessionConfiguration.defaultSessionConfiguration()
configuration.URLCache = NSURLCache(memoryCapacity: 0, diskCapacity: 0, diskPath: nil)
let session = NSURLSession(configuration: configuration)
defer {
    session.finishTasksAndInvalidate()
}
let task = session.dataTaskWithURL(url) { data, response, error in
    // ...
But this didn’t help. What did end up working was using an ephemeral session:
let session = NSURLSession(configuration: NSURLSessionConfiguration.ephemeralSessionConfiguration())
let task = session.dataTaskWithURL(url) { data, response, error in
    // ...
With that in place, here’s what Instruments showed me:
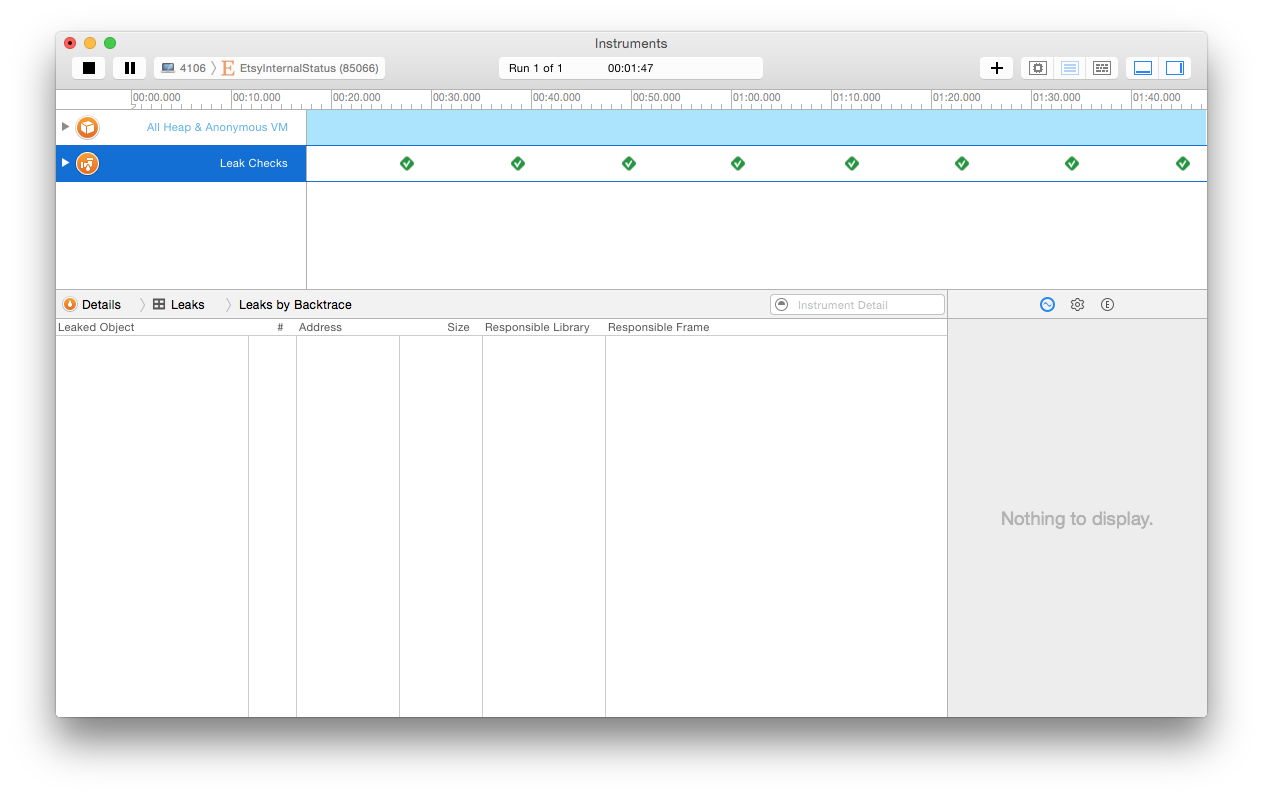
Yay! No leaks!
We Don’t Need No Stinkin’ GUI
If you’re more of a command-line gal, there’s another way to investigate leaks built into OS X: the leaks command:
$ leaks EtsyInternalStatus
Process:         EtsyInternalStatus [24147]
Path:            /Applications/EtsyInternalStatus.app/Contents/MacOS/EtsyInternalStatus
Load Address:    0x105eaf000
Identifier:      com.etsy.EtsyInternalStatus
Version:         1.2.3 (1.2.3)
Code Type:       X86-64
Parent Process:  ??? [1]

Date/Time:       2015-09-02 20:33:26.173 -0700
Launch Time:     2015-09-02 20:30:44.447 -0700
OS Version:      Mac OS X 10.10.5 (14F27)
Report Version:  7
Analysis Tool:   /Applications/Xcode-beta.app/Contents/Developer/usr/bin/leaks
Analysis Tool Version:  Xcode 7.0 (7A192o)
----

leaks Report Version:  2.0
Process 24147: 25225 nodes malloced for 15639 KB
Process 24147: 615 leaks for 5321984 total leaked bytes.
Leak: 0x10a02f000  size=135168  zone: MallocHelperZone_0x105f65000  length: 5020
...
<snipped 7800 lines of leaked memory dumps>
Now, the fixed version:
$ leaks EtsyInternalStatus
Process:         EtsyInternalStatus [85066]
Path:            /Applications/EtsyInternalStatus.app/Contents/MacOS/EtsyInternalStatus
Load Address:    0x102d2f000
Identifier:      com.etsy.EtsyInternalStatus
Version:         1.2.4 (1.2.4)
Code Type:       X86-64
Parent Process:  ??? [1]

Date/Time:       2015-10-10 10:27:29.556 -0700
Launch Time:     2015-10-10 10:16:11.476 -0700
OS Version:      Mac OS X 10.10.5 (14F27)
Report Version:  7
Analysis Tool:   /Applications/Xcode.app/Contents/Developer/usr/bin/leaks
Analysis Tool Version:  Xcode 7.0.1 (7A1001)
----

leaks Report Version:  2.0
Process 85066: 62741 nodes malloced for 6598 KB
Process 85066: 0 leaks for 0 total leaked bytes.
The eagled-eyed among you might have noticed that about a month elapsed between me running those checks (life intervened), and there was an Xcode release in the meantime. Turns out that when I ran the leak check again on the leaky version of the app, it was fine! I’m guessing that it was a bug in Apple’s networking code after all, and it got fixed in the latest release.
Try out leaks on some of the other apps you have running. You’ll find that leak-free apps are oddly rare, and some are downright eggregious (my beloved Sublime Text text editor, in which I’m writing this post, shows “577841 leaks for 44554352 total leaked bytes.” Oof).
For more information, see Apple’s documentation on Finding Memory Leaks.